Salesforce is great sometimes at deciding for me what it thinks I want. In reports, you get some basic sorting options - Ascending and Descending which is good if your data conforms to that model. Most of the time it will because it's a date, monetary value, etc. However, that's not always the case and you can use the bucket field to hack your way into seeing the values the way you want to see them.
What if we want to force the sort order of data on a report or dashboard so the data shows in the stacked order you want.
Here’s an example, suppose you have a custom picklist field on the opportunity object called “Deal Type” with Values - New, Existing Business, Renewal , Referral.
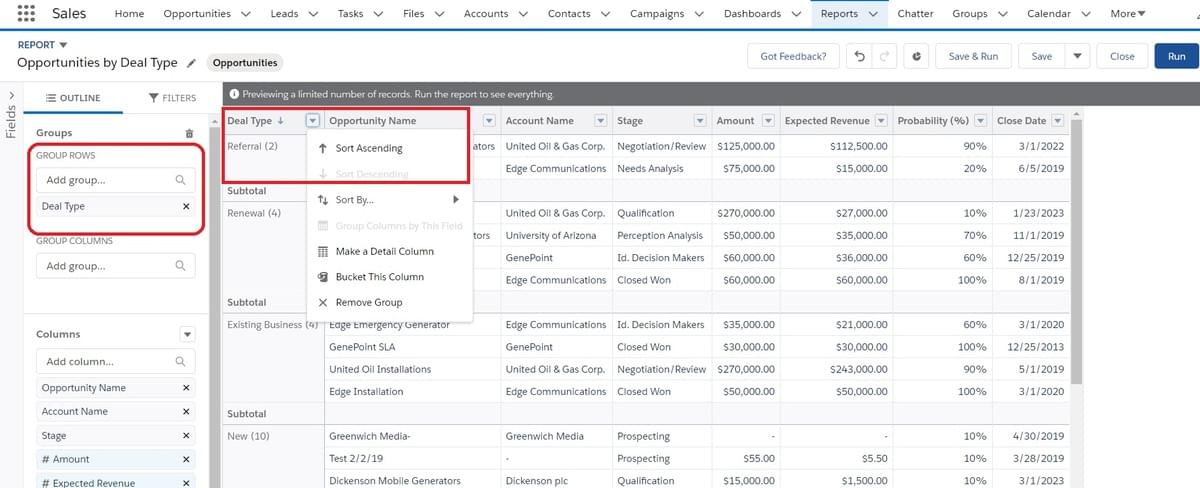
Create a report on the Opportunities and choose the grouping by the “Deal Type” field.
You will also have the option to sort the report ascending or descending from the perspective of that field.
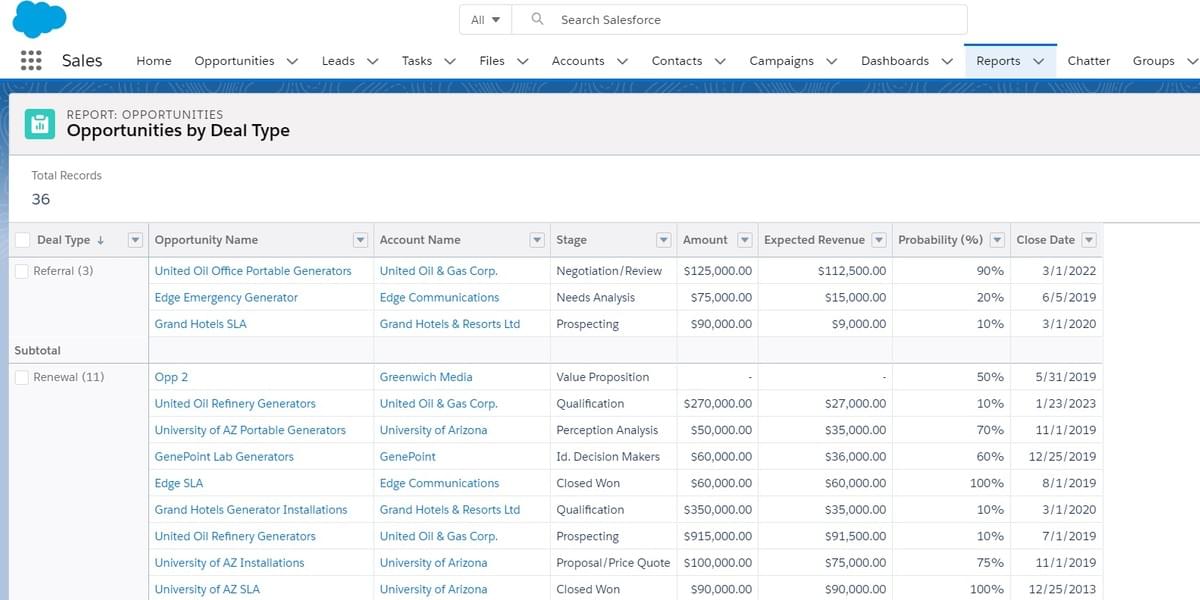
Then run the report after you choose the sorting required. This will give you a summary of the opportunities based on the Deal Type field and sorted ascending or descending as you choose.
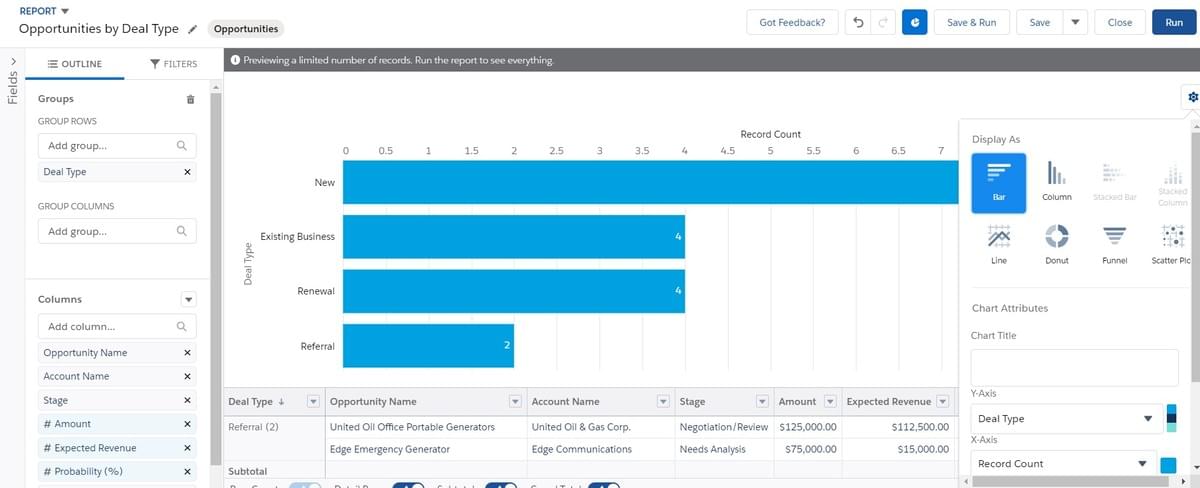
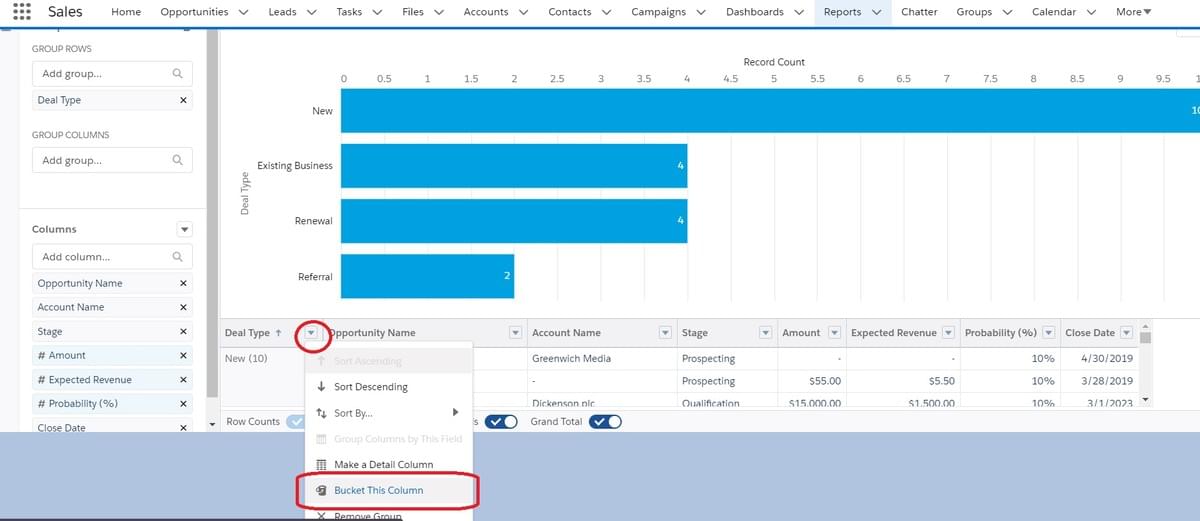
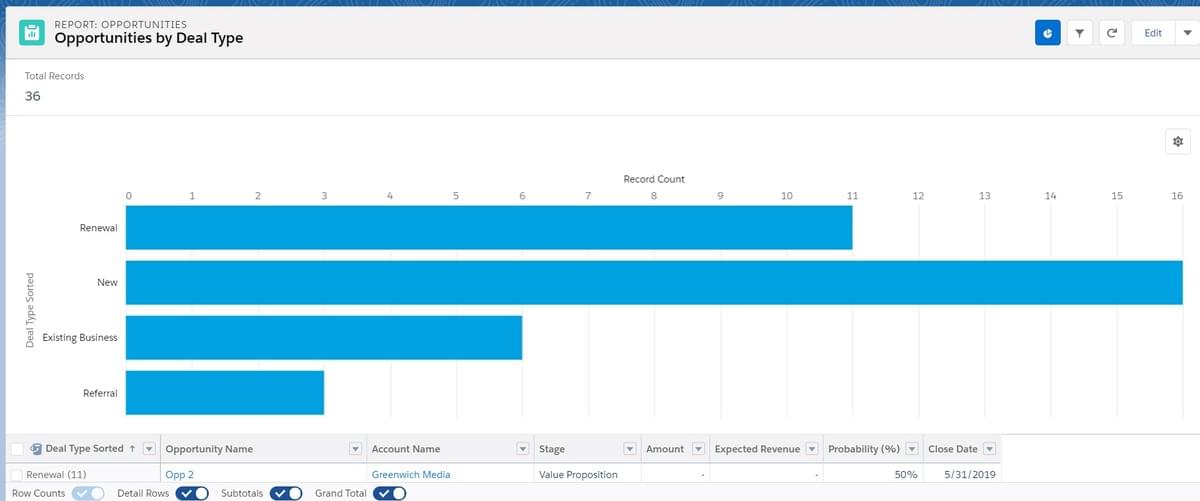
You can also choose to add a chart! This will visualize your data even better. Just add a chart from the edit preview and choose the chart type you like. This example is showing the bar chart.
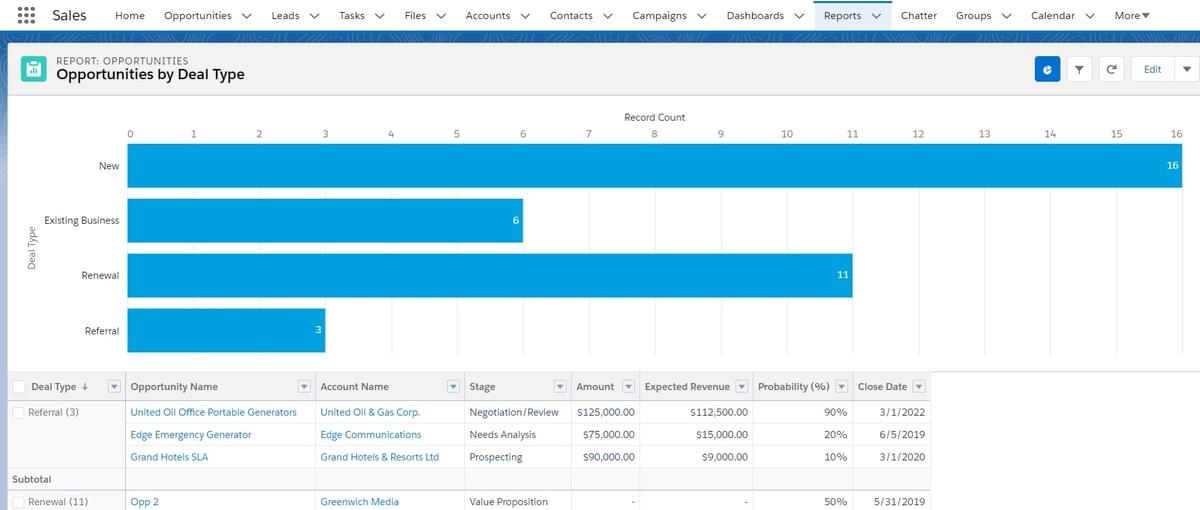
Run the report after adding the chart and choosing the sorting order and you will see how beautiful your data is visualized.
Now, what if you want to force the order of the values of the “Data Type” field to be with specific order neither ascending nor descending. For example, you want the values to be in this order: Renewal, New, Existing Business , Referral. From the edit preview , beside the “Deal Type” field there is an option called “Bucket This Column”.
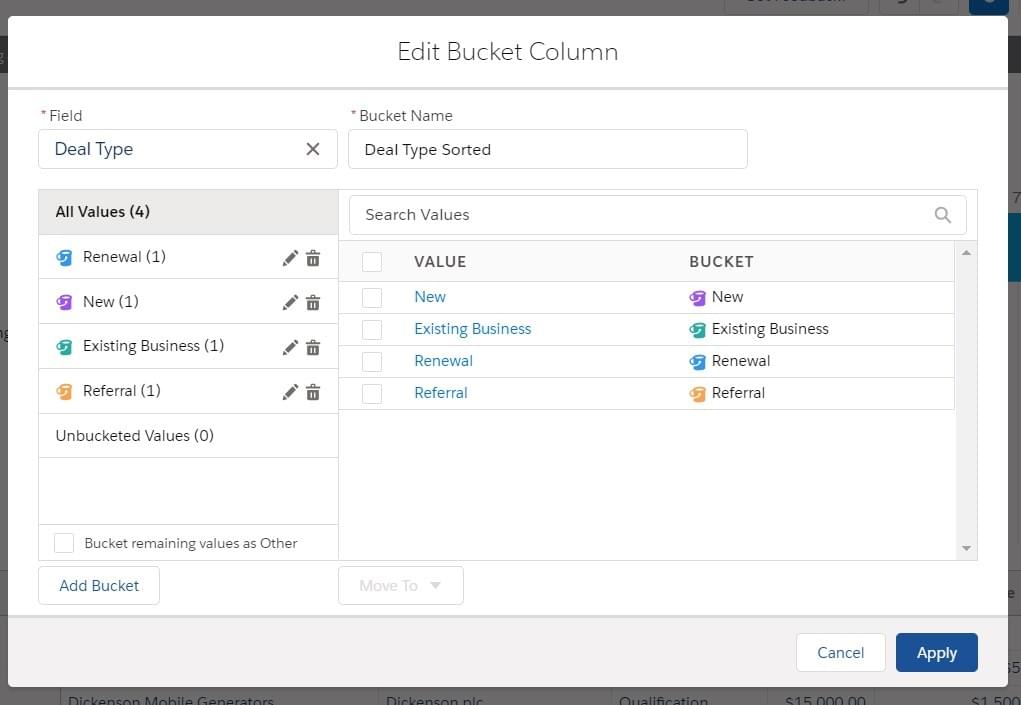
Create the Bucket field values with the same exact values as the picklist but in the new order required. Then match the bucket values with the respective bucket.
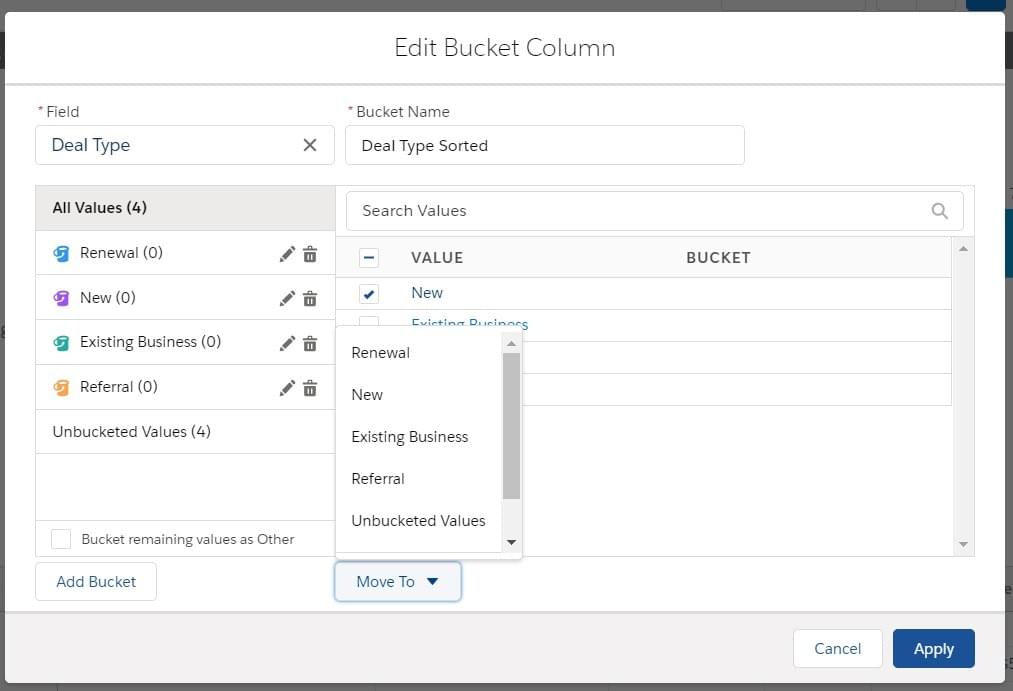
It should look like this:
Choose the grouping to be by the newly created bucket field and you will find them in the new order.
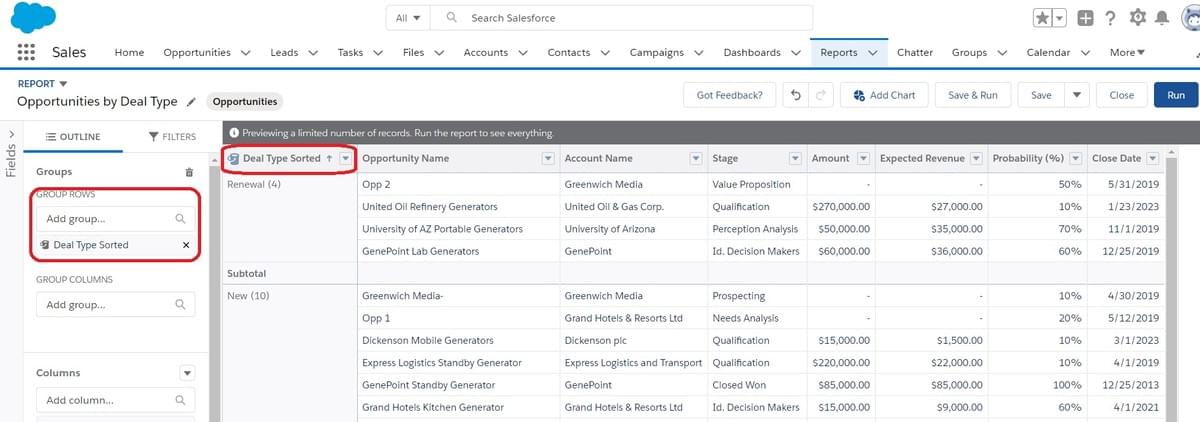
Add the chart again and run the report.
You will find the chart and the report sorted nicely as required. The “Bucket” feature is a powerful tool that can be used in different ways.